Geophysical R&D consultancy to the Energy Industry
2D/3D/4D/4C/5D land and marine seismic savvy: O&G; azimuthal anisotropy; near surface ultra high resolution renewable energy site surveys. e.g. offshore wind farms with Fugro
E&E not O&G
Practical and commercially aware of Energy and Environmental needs.
- Advice on the latest sub-surface seismic imaging techniques & best practice, e.g. de-ghosting & broadband seismic.
- Diverse seismic platform software development experience, e.g. BNU, REVEAL, GEOVATION, UNISEIS
- Pioneers of HPC in Linux multi-core/multi-hardware parallel HPC environments.
- Software development using C/C++, Fortran, Python.
- Can provide software evaluation, development or optimization capabilities.
- Versatile geophysical experience: magnetic, gravity & electrical surveying methods.
Geophysical software and tool development
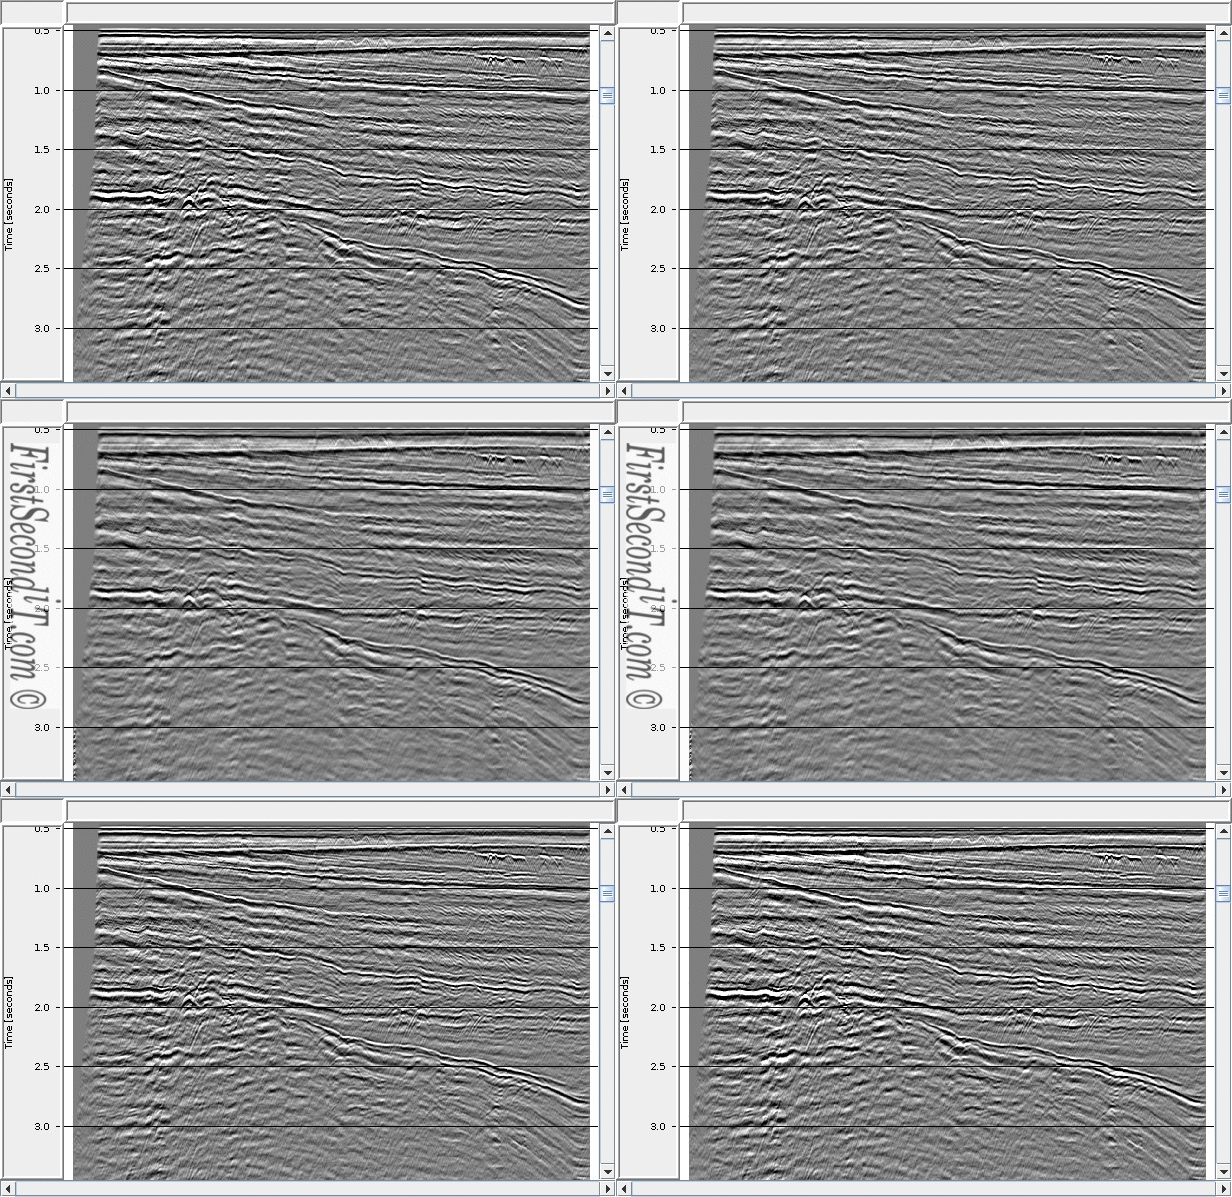
BNU scalable parallel seismic processing
Mobil AVO Viking Graben line 12. Velocity field picked with PEGASUS. Seismic plot by SU/SEAVIEW
Scalable high performance computing (HPC) solutions
Parallel programming using MPI, OpenMP, C/Fortran 2k+
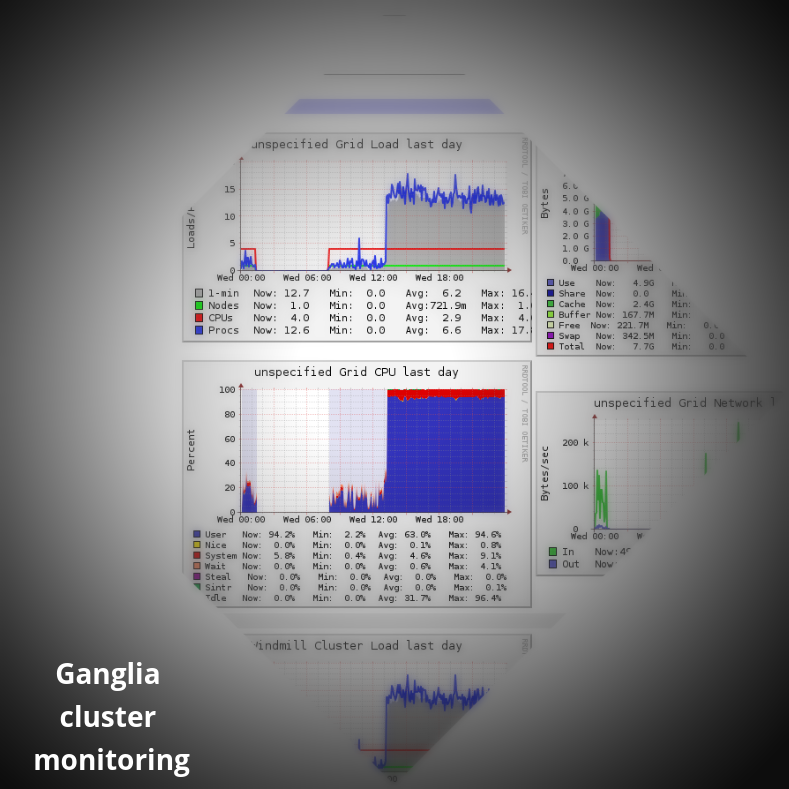
Linux cluster administration and monitoring: Ganglia, PBS/Torque, Slurm
Linux expertise + Android and FPGA experience.
Extract signal from big noisy data.
Algorithm insight by visualization
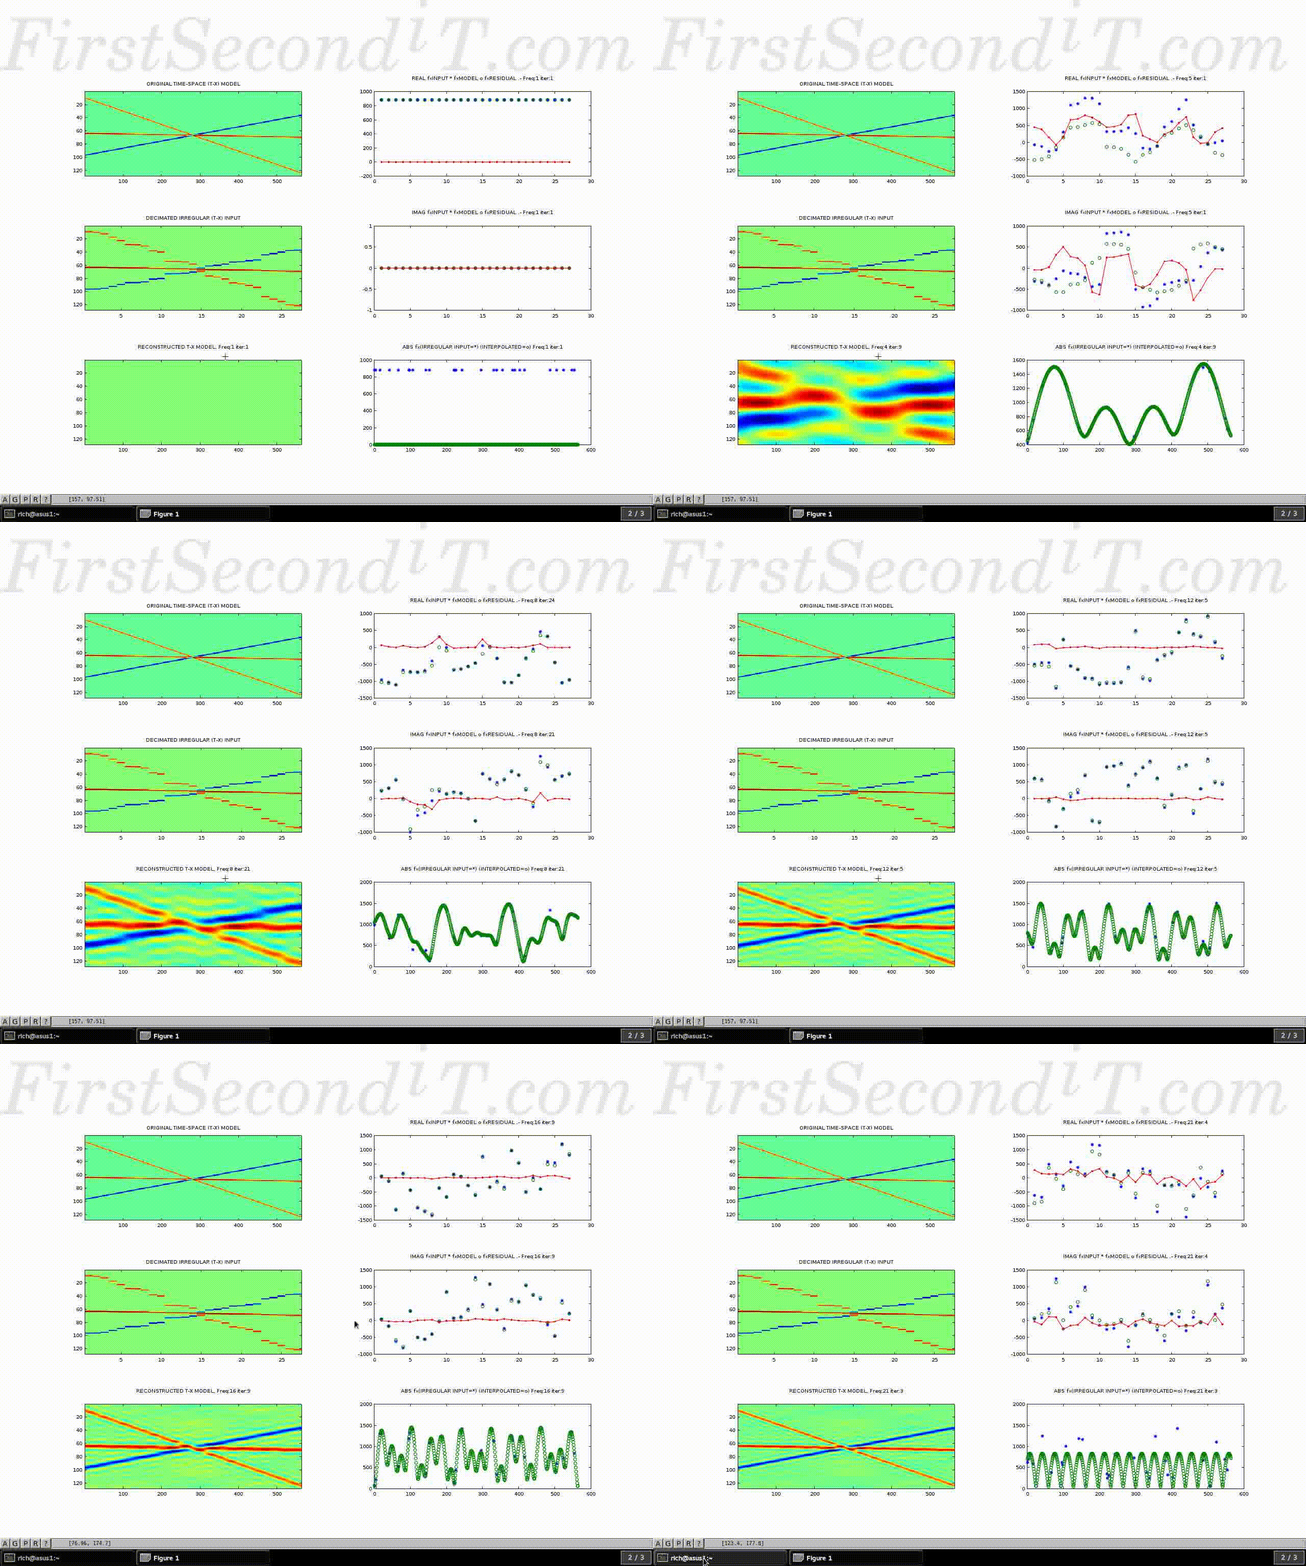
Demonstration of an interpolation algorithm, suitable for regularizing seismic data. The challenge is to derive parameters of a mathematical model which best reconstruct the input data.
- Top left: Synthetic seismic event model with 3 different and conflicting dips, polarities and magnitudes. In this case the seismic reflectors are purely linear in nature, but the method works well on undulating curved reflectors too.
- Middle left: block schematic of sparse irregular input data (observations extracted from 1). This is shown with clear blocks for ease of visibility, being repeated laterally in a series of steps until the next sample position along the X axis. The data is actually highly sparse, but is difficult to see at this plot scale.
- Lower left: gradual reconstruction of the whole model space, by back projection of its Fourier components as they are derived.
The images on the right hand side show iterations of a basis pursuit algorithm to match the input complex frequency domain values. (sparse points are displayed regularly in X, where * is input, o is model, and the red line is their residual.)
(the example loops after solving for the first 21 temporal frequencies)
This is an example of physics based data learning where a mathematical model or function is chosen which can represent the target data or image when either sparse or well sampled. In this case the complex spatial Fourier domain is well suited to a range of image data. The matching algorithm finds a set of Fourier coefficients from a large data dictionary which best matches the sparse irregular input data. This method extrapolates lower spatial wave number coefficients as masks to automatically guide the resolution of higher wavenumber terms to avoid aliasing artefacts. Finally the algorithm uses an inverse 2D Fourier transform to estimate the full model at any desired output X,Y resolution. These techniques have applications in so-called 'compressive sensing', where even more sophisticated functions might be used, e.g. curvelets.
For regularly sampled data, gridded convolutional methods are popular. These are capable of performing super-resolution up-scaling. Such methods often use a range of image properties to minimize aliasing and improve image clarity.
First Second iT LTD
Registered in England & Wales: 10028301
info@firstsecondit.com
Mill House Cottage, Salters Lane, FAVERSHAM, ME13 8ND, UK.


